
64 Healthcare Denial Statistics For 2026

The 66 Denial Statistics for 2026 highlights the rising financial and operational risks of claim rejections across Medicare Advantage, commercial, and ACA plans. This data-driven roundup by TempDev underscores how preventable denials, workflow gaps, and prior authorization burden erode revenue—and where targeted automation and smarter denial management can deliver outsized ROI.
How Severe Are Current Denial Rates?
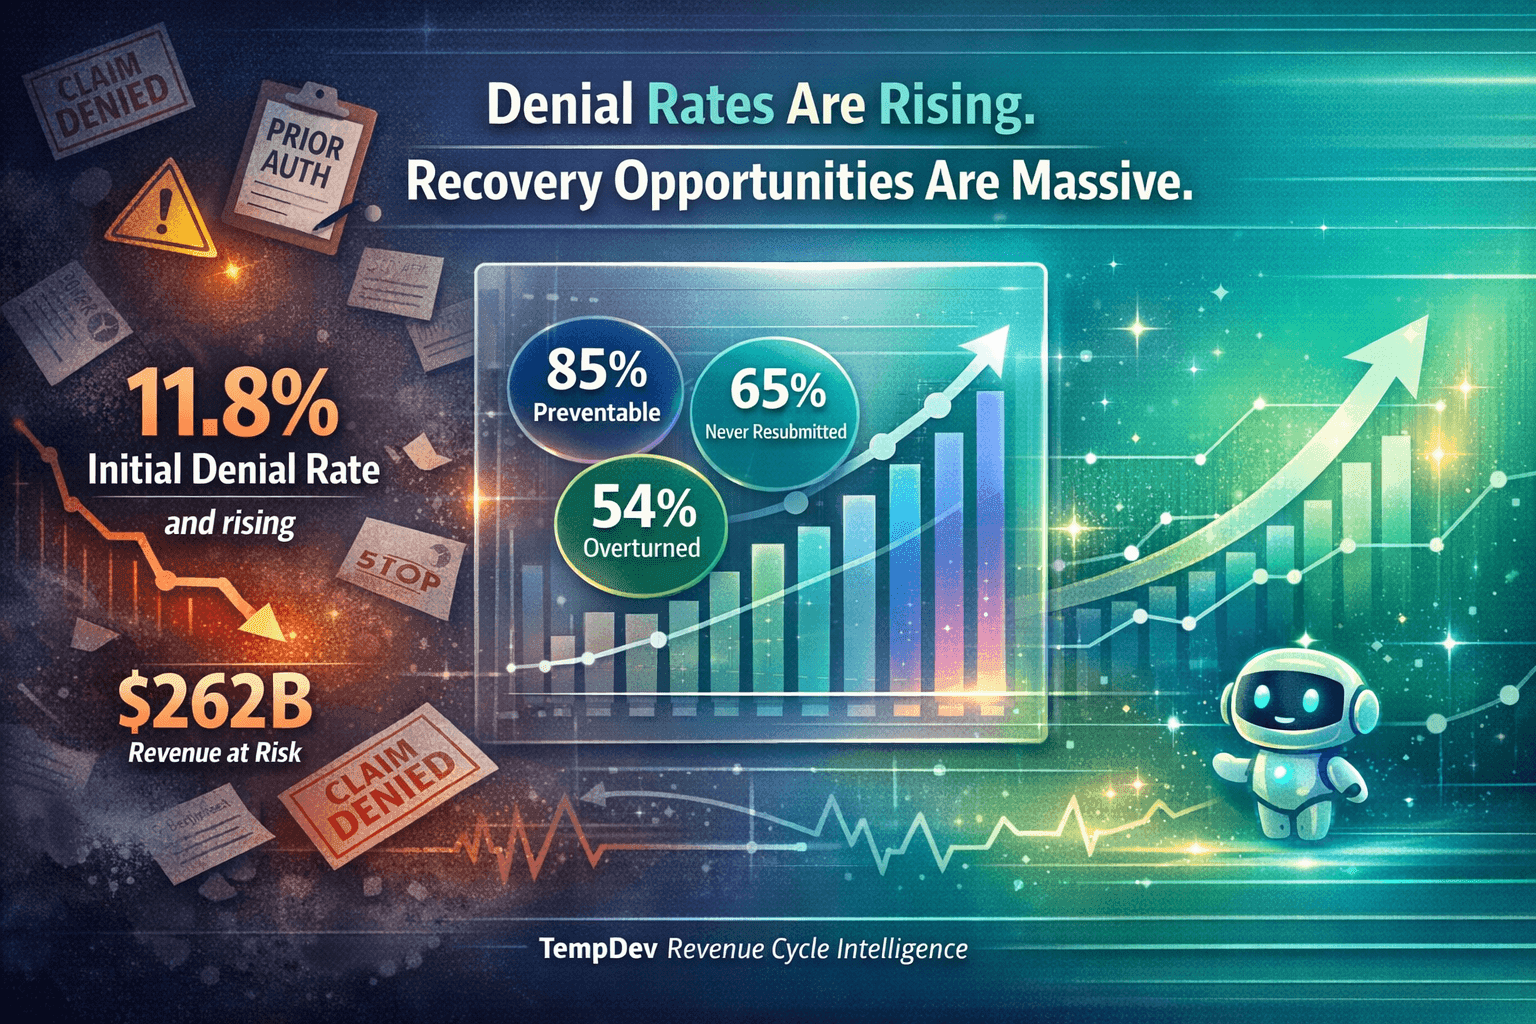
The healthcare industry is experiencing unprecedented claim denial pressures, with initial denial rates climbing to 11.8% in 2024—a 16% increase from 2020 levels. More than one-third of providers now report denial rates exceeding 10%, signaling a systemic challenge that extends across both Medicare Advantage and commercial payers.
Initial denial rate reached 11.8% in 2024, up from 10.2% in 2020.
38-41% of providers report denial rates of 10% or higher.
Final denial rate (after appeals) is 2.8% in 2024, representing claims ultimately written off.
Final denial rate is 16.7% higher than in 2020.
Denial rates increased 33% from 2016 to 2022 (from 9% to 12% per Optum/Change Healthcare Denials Index).
19% of in-network claims submitted through HealthCare.gov insurers were denied in 2023.
Medicare Advantage initial denial rates average 15.7%.
Commercial payer initial denial rates average 13.9%.
Private payer denial rates increased from 8% to 11% between 2021-2023.
Private payer denial rates (survey of 516 hospitals) averaged 15%.
Medicare Advantage denials increased 55-56% between January 2022 and July 2023.
Medicare Advantage net patient revenue denials increased by more than 63%.
Claims denial rates saw 23% increase from 2016 to present.
54% of providers agree claim denials are increasing.
89% of hospitals experienced denial increases over the past 3 years.
51% of hospitals said denial increases were "significant".
33% of hospital executives cite average denial rates of 10% or more.
77% of providers say denials are increasing.
What Is the True Financial Impact of Claim Denials?
Claim denials represent one of healthcare's largest hidden revenue drains, with an estimated $262 billion in annual losses at the initial rejection stage. Beyond the lost revenue itself, the administrative burden of managing, appealing, and reworking denied claims consumes an additional $19.7 billion annually.
Hospitals lose $262 billion annually to initial claim denials (63% potentially recoverable).
Providers spend $19.7 billion annually fighting/processing denials.
Administrative cost per denied claim increased from $43.84 (2022) to $57.23 (2023).
Cost to rework a denied claim ranges $25-$181.
22% of healthcare leaders say their organization loses at least $500,000 annually to denials.
10% of healthcare leaders report losing over $2 million annually to denials.
Average administrative cost to rework MA denial: $47.77.
Average administrative cost to rework commercial denial: $63.76.
Hospitals spend nearly $8.6 billion annually managing denials.
Hospitals lose an average of $5 million annually to denials.
Providers spend $25.7 billion annually on claim adjudication.
$300M at stake for top hospitals with unresolved denials.
Average denial pegged to charges of $14,000 or more.
15 cents of every healthcare dollar uncollected due to revenue cycle inefficiencies.
Healthcare providers lose an average 4.8% of net revenue to denials.
Average denials represent 3% of net revenue lost (and creeping skyward).
Gross charges denied jumped 15-20%.
Labor accounts for 90% of claims processing expenses.
Claims submission costs increased 67% per CAQH Index data.
Why Are Claims Being Denied?
The overwhelming majority of claim denials—76% of all rejections—stem from data quality issues, particularly missing or inaccurate patient information collected at intake. While one-third of denials remain categorized under vague "Other" reasons (reflecting payer opacity in denial coding), the root causes are clear and addressable: administrative oversights, lack of prior authorization, service coverage gaps, and unsubstantiated medical necessity claims comprise the remaining denial drivers.
46% of denials from missing/inaccurate data.
34% of denials categorized as "Other" (unspecified reason).
18% of denials due to administrative reasons.
Non-covered services account for 16% of claim denials.
9% of denials due to lack of prior authorization or referral.
6% of denials based on medical necessity.
68% of providers cite inaccurate/incomplete patient data at intake as primary denial driver.
Payers denied 3.2% of claims even though they had prior authorization.
Request-for-information (RFI) denials increased from 3.2% to 3.5% of total billed charges between 2022-2024 (approximately 9% relative increase).
How Many Denials Are Actually Overturned on Appeal?
The data reveals a critical gap in the appeals landscape: although prior authorization appeals overturn 83.2% of denials and 54% of private payer denials are eventually reversed, providers appeal fewer than 1% of all denied claims.
54.3% of denied claims by payers ultimately overturned (after multiple appeals).
57% of Medicare Advantage initial denials overturned on appeal.
60-80% of insurance denials overturned in certain states (varies by state).
81.7% of Medicare Advantage prior authorization appeals result in partial or full overturn (2019–2023 average).
Less than 1% of denied claims are appealed.
When ACA marketplace enrollees appeal, insurers uphold 56% of appeals (44% overturned).
Only 10% of denied prior authorization requests are appealed.
62% of prior authorization denials that are appealed get overturned.
50% of initial claims denials that are appealed get overturned.
What Percentage of Denials Go Unaddressed?
The most troubling finding in denial management is organizational inertia: providers abandon 65% of denied claims without resubmitting or correcting them, leaving major revenue recovery opportunities unrealized.
35-60% of denied claims are never resubmitted.
65% of denied claims are never corrected and resubmitted.
76% of RCM leaders identify denial management as the most time-consuming task.
Physicians spend 13 hours/week on prior authorization per physician.
85-87% of denials are preventable/avoidable.
86% of denials are potentially avoidable (MGMA).
High-performing organizations: <5% denial rate.
Struggling organizations: >15% denial rate.
Medium-sized health systems saw 6-to-1 ROI on denial prevention (~$6M savings per hospital).
Ready to get more of your NextGen system?
Help your organization achieve measurable improvements in efficiency, compliance, and performance.